
A cycle count program differs from other types of inventory count program. They key to an effective cycle count program is being able to quickly and efficiently audit inventory variance to determine the root cause, then changing your work instructions so that we eliminate root cause from causing additional errors. Read on to learn more.
This article is aimed at warehouse professional who are setting up their first cycle count programs
Start small
To begin start with a small sample. Starting off with all your parts at the beginning will just leave you overwhelmed. My advice is to to pick 20-50 parts that are problematic. For the first week just count 10 to 20 parts.
At first don’t worry too much about your ERP’s cycle count functionality. We need to develop habit and hone your skills at counting, auditing and investigating root causes. You may find you spend a lot of energy as well changing your work instructions and re-training the team. Once you’ve honed your skills, things will become easier and your can recreate your cycle count program using your ERP functionality.

Set a rhythms
You can set you own schedule, count daily, every other day, two days a week, weekly or monthly (don’t do it monthly). The best way to develop an habit and demonstrate the importance of the process is to count daily. If resources are limited I would recommend you pick a smaller sample rather than a larger interval.
- The shorter interval will help you much better at investigating. You only need to audit one day’s of transactions vs. say one week of transactions.
- Counting more frequently will help you develop the habit much more quickly.
The ABCs of inventory classification
To start just pick 20 to 50 parts as suggested above. You know which 20-50 parts are problematic. Eventually tough, you’ll want to formalize your part selection and rotation with what is commonly known as ABC analysis. Personally I prefer ABCD analysis. When ready to boost up your initial set of parts we will use Pareto analysis to determine the percentages. more on percentages and Pareto analysis later:
- A — counted every four weeks. These are the few parts that account for most of your revenue or activity.
- B — counted every twelve weeks. This is your secondary category. You should have more SKU in this category than you have in your A category. They should represent about the same or lesser value.
- C — counted every twenty four weeks. This is the remainder of your inventory that is actively being sold/used.
- D — counted every forty eight weeks. This category is all the stuff you have in your warehouse that just does not get used or sold. Think of it as the “junk” you have that your boss won’t let you toss.
Your first week
On day one count your initial sample parts. Today you get a reprieve. Just update the count in your ERP and wait for tomorrow. Remember at this stage we are focused on honing our skills and developing a habit and a cadence. If we count every day we need to finish our investigation by end of day. Tomorrow there will be more stuff to count and, possibly new inventory variances to investigate. So you don’t get overwhelmed. Narrow down your sample if needed.
On day two count the same parts you counted on day one. Compare that to your book value (the quantity your ERP thinks you should have). If there is a discrepancy, then investigate and find out how that error came about. If you updated the ERP on the first day you only have one day of transactions to dig through. This is going to be difficult at first but stick with it. If all the parts you counted have errors and you don’t have the resources to investigate all of them, then pick the worst three or the three that have the greatest financial impact. Just update the inventory count for the other parts in your ERP.
This will be specific to your environment but some common causes could be:
- Andrea grabbed parts from one location but recorded a different pick location.
- Bert did not receive the right quantity.
- Christopher forgot to process the stock move when he relocated parts form shelf A to shelf B.
- The timing of recording the inventory transactions are not happening in real time. So possibly a Danielle has not yet updated the ERP with yesterday’s transactions.
- Erin missed counting a box hidden behind a larger box of widgets.
- Fatih just noted the quantity on the sticker on the outside of the outer carton instead of looking inside to confirm the exact count.
It could be anything. You need to learn how to find out. Stick to it like a dog to a bone. Even if it takes you more than one day. As you hone your investigative skills you get better and faster at identifying root causes.
Congratulation, now you know why stuff goes wrong. Sit down with the team, share your findings and update your work instructions.
Day three, just like groundhog day, repeat what you’ve done on day two. Count the same parts introduce a few additional parts from your initial sample set.
Day four, repeat what you’ve done on day two and three. Count the same parts. Add a few more part to the roster gradually.
Week two
Expand your sample. Start rotating between the list of 20-50 parts your initially identified. The process is the same: count, audit, investigate, update ERP and fix your work instructions.
Month two and three
At the two month stage you should be ready to start counting a much larger sample such as all your A and B item. At month three you can introduce C and D parts.
ABC Analysis
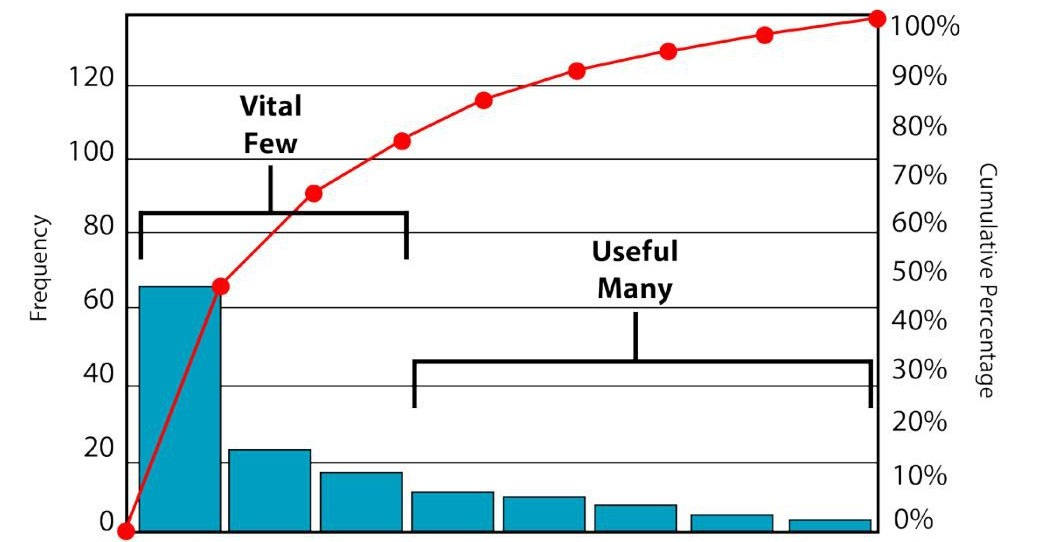
ABC analysis is based on Pareto Analysis principles. Learn more about it on the Wikipedia page. Simply put we can say that the vital few SKUs account for the majority of sales. Per the chart below we could infer that A items SKUs account for 45% of revenue. B items account for 20% of revenue, and the remaining C & D item make up the remaining 35% of revenue.
Leverage your ERP it if is capable of performing an ABC analysis. If not dump your inventory parts in a excel file include cost or price of the part, qty sold or consumed over a period of time. A year is typically accepted as appropriate. However six month would do but 1 month may be too small to represent distributions of sales across all you SKUs. Multiply volume (quantity) by cost and sort the list in descending order of revenue or cost. Split the data so as to roughly 80% of your revenue is from 20% of your SKU. That is roughly your A category, Do the same remainder. Until you have three (or four categories as I prefer) where your last category is roughly 80% of your SKUs representing 20% of your revenue.
Split items in groups so that you count:
- A — counted every four weeks. Divide the number of SKUs by 20 working days.
- B — counted every twelve weeks. Divide the number of SKUs by 60 working days.
- C — counted every twenty four weeks. Divide the number of SKUs by 120 working days.
- D — counted every forty eight weeks. Divide the number of SKUs by 240 days.
Each day (count interval) count 1/20th of A SKUs, 1/60th of B SKUs 1/120 of C SKUs and if opting for D category 1/240th of SKUs.
If you ERP has functionality to manage a cycle count program now is the time to read up on it an get it setup to the best of your capabilities. If not, a spreadsheet can help you determine which parts to count on what day.
Reporting
Track your progress. In a spreadsheet record the number of parts counted and the number of adjustment you posted for each day. Now you can measure your progress over time and see if the changes in your work instructions are yielding results.
Conclusion
Cycle counting is daunting at first. It is easy to get overwhelmed and discouraged. Especially if the team responsible for counting and reporting is at odds with the team doing day to day transactions.
If you fail, step back pick a smaller sample and move forward again. Give it three months at a minimum. The amount of variance should decrease overtime and your should note other benefits, such as improved order fill rate, improved order picking cycle time. etc.
Best of luck. If you have questions post the in the comment section. I’ll do my best to reply promptly.
Recommended reading.
I recommend Inventory Record Accuracy: Unleashing the Power of Cycle Counting by Brooks, Roger B., Wilson, Larry W. When stared my first cycle count program I bought this books. Its got scribbles all over it. I liked it so much I bought additional copies for the whole team. Sadly this book used to cost about $20.00. If you search online stores you should be able to pick up a copy for around $30.00-60.00. The older edition (2007) is still very much relevant and cheaper.
